



"My store feels slow" is not a diagnosis. It's a symptom, and acting on a feeling is how merchants waste a weekend installing a cache module that fixes nothing. The first job isn't to fix anything. It's to find out, with numbers, whether your store is genuinely slow, where the slowness lives (the server? the page weight? the database? a single rogue module?), and how bad it actually is. Get the measurement right and the fix usually picks itself. Get it wrong and you'll optimise images on a store whose real problem is a 1.8-second Time to First Byte that no image trick will touch.
This guide is the diagnosis step: how to check a PrestaShop store's speed properly, how to read what the tools tell you, and how to turn that reading into a ranked to-do list. The deep fixes, database tuning, full-page cache, Redis, hosting, each have their own dedicated guide, and we link you to the right one at each branch instead of cramming a shallow version of all of them here.
Reviewed June 2026. Everything here applies to PrestaShop 1.7, 8.x and 9.x. The profiler toggle lives in the same file on all three. On PS8/9 you also get the Symfony debug toolbar with per-request query counts, noted below.
Why your own impression of speed is the least reliable test
You browse your store from an office, on a wired or strong connection, often logged into the back office. Which means PrestaShop's debug profiler and a warm cache are working in your favour, and you're hitting pages you've already loaded today. Your customer is on a mid-range Android phone, on mobile data, arriving cold on a category page Google sent them to. Those are two different stores. The merchant who says "it feels fine to me" and the analytics that say checkout abandonment spikes on mobile are both telling the truth, they're just measuring different machines.
So before any tool: if you're testing while logged into the admin, you're not seeing what customers see. Open the front office in a private/incognito window, or better, throttle your browser to "Slow 4G" in Chrome DevTools. That alone reframes the conversation for most owners.
The four checks worth running (and what each one actually tells you)
You don't need ten tools. You need four readings that, together, tell you whether the problem is the server, the page, or the data, because those are three different repair shops.
| Check | Where | Lab or real-user | Tells you about |
|---|---|---|---|
| PageSpeed Insights | pagespeed.web.dev | Both (lab + CrUX field) | Front-end weight, render-blocking assets, the headline score |
| Core Web Vitals report | Google Search Console | Real users (28-day field) | What Google actually ranks on, by URL group |
| Waterfall / TTFB | GTmetrix or DevTools Network tab | Lab | Server response time vs. asset download time, the server-vs-page split |
| Debug profiler | PrestaShop back office | Lab (your server) | Per-page SQL query count and PHP load time, the database/module split |
PageSpeed Insights, read the field data, not just the number
Enter your store URL at pagespeed.web.dev and you'll get a mobile and a desktop score. The mobile score is the one that matters: Google indexes mobile-first and most storefront traffic is mobile. But the score (the big coloured circle) is a lab simulation. Scroll up to the section that may say "Discover what your real users are experiencing", that's the CrUX field data from actual Chrome visitors, and it's the truer picture. A store can score 55 in the lab simulation yet pass Core Web Vitals in the field, or vice versa. Read both.
As a rough orientation for the lab score:
- 90–100, you're in good shape; spend your effort elsewhere.
- 50–89, there's real money in the gap; worth a structured pass.
- Below 50. This is costing you traffic and conversions now; treat it as urgent.
A PageSpeed score in the 90s is achievable on a real PrestaShop store running a heavy module stack, it isn't a theoretical target reserved for empty demo installs. We documented exactly how on a live PrestaShop store in PageSpeed 99/100 on a real store with 130 modules, which is the proof-of-concept companion to this diagnosis guide.
The three Core Web Vitals, and what each failure points at
Google scores real-world speed through three metrics. The value isn't the number itself. It's that which metric fails tells you which repair shop to walk into.
- Largest Contentful Paint (LCP). Time until the main content is visible. Target under 2.5s. On a PrestaShop category or product page this is almost always the hero or first product image, or a slow server delivering the HTML late. A failing LCP points at images or TTFB.
- Interaction to Next Paint (INP), how fast the page reacts when a customer taps. Target under 200ms. Failing INP points at heavy or duplicated JavaScript, usually too many front-office modules each injecting their own scripts.
- Cumulative Layout Shift (CLS), how much the layout jumps while loading. Target under 0.1. Failing CLS points at images served without width/height attributes, late-swapping web fonts, or a slider/cookie banner that pushes content down after paint.
The waterfall and TTFB, the single most useful split
Open GTmetrix (or your browser's DevTools Network tab) and look at one number before anything else: Time to First Byte (TTFB), the gap between the browser asking for a page and the first byte of the response arriving. This is the cleanest fork in the whole diagnosis:
- TTFB consistently above ~500–600ms on a cache-cold page → the bottleneck is server-side: PHP generation, the database, or the hosting itself. No amount of image compression or front-end work will fix this. This is the branch that leads to caching, database, and hosting fixes.
- TTFB low but the page still feels heavy → the server is doing its job; the weight is in the front end, images, fonts, CSS/JS bundles downloading after the HTML arrives.
That one reading saves more wasted effort than any other. Merchants who skip it spend days minifying CSS on a store whose problem was a 1.8s database-bound TTFB.
The PrestaShop debug profiler. The database/module reading nobody runs
This is the check that's specific to PrestaShop and that most owners never touch, yet it's the most diagnostic. On a staging copy, open config/defines.inc.php and set _PS_DEBUG_PROFILING_ to true. That's the switch that turns on the front-office profiler bar and its query-count readout. The exact line you're looking for:
// config/defines.inc.php – staging only, switch back to false when done
define('_PS_DEBUG_PROFILING_', true);
On PrestaShop 8 and 9 you have a second, easier readout: with the shop in dev mode the Symfony debug toolbar sits at the bottom of every back-office and front-office page and shows the SQL query count and total time for that request, no file edit needed beyond enabling debug. Either way, the number you care about is the same.
You only need to enable _PS_MODE_DEV_ (full debug/error mode) if you deliberately want dev error output as well; it isn't required just to see the query count, and it's riskier to leave on. Then load a category and a product page. PrestaShop renders a profiler bar showing load time and, critically, the number of SQL queries for that page. A healthy page is tens of queries; if a single product page is firing several hundred or a couple of thousand queries, you've found your slowness, and it's almost always a specific module looping queries or an un-indexed table, not "PrestaShop being slow." Turn both switches back off before you're done; never leave them on in production.
From reading to a ranked to-do list
Diagnosis is only useful if it produces an order of operations. Map your readings to the fix, cheapest-and-highest-impact first, and follow the link to the guide that covers that fix in depth rather than a paragraph here:
| What your check shows | The likely cause | Where to fix it |
|---|---|---|
| Low score, heavy images in the waterfall, failing LCP/CLS | Unoptimised, oversized, eagerly-loaded images | Image optimisation, alt tags & lazy loading |
| Failing INP, many JS files, high module count in Design → Positions | Too many front-office modules | Audit modules (below) + what actually makes PrestaShop slow |
| High TTFB, high SQL query count in the profiler | Database queries / missing indexes | Database queries → full-page cache tuning |
| TTFB creeping up as the store ages | Bloated tables, old carts/logs/connections | Database cleanup over time |
| High TTFB, every page regenerated from scratch | No full-page cache | Full page cache modules explained |
| High TTFB, file/DB-based cache, frequent cache reads | Slow cache backend | Redis for PrestaShop · Redis setup & gains |
| High TTFB that survives every software fix above | The hosting itself | Choosing hosting: what matters vs. marketing |
The two free checks to run before you spend anything
One free command gives you a first split between DNS/connect time, server wait and total transfer. It is not a Lighthouse replacement, but it tells you whether to start at hosting/PHP/database or at front-end payload.
url="https://example.com/"
curl -o /dev/null -s -w 'dns=%{time_namelookup}s connect=%{time_connect}s ttfb=%{time_starttransfer}s total=%{time_total}s
' ";$url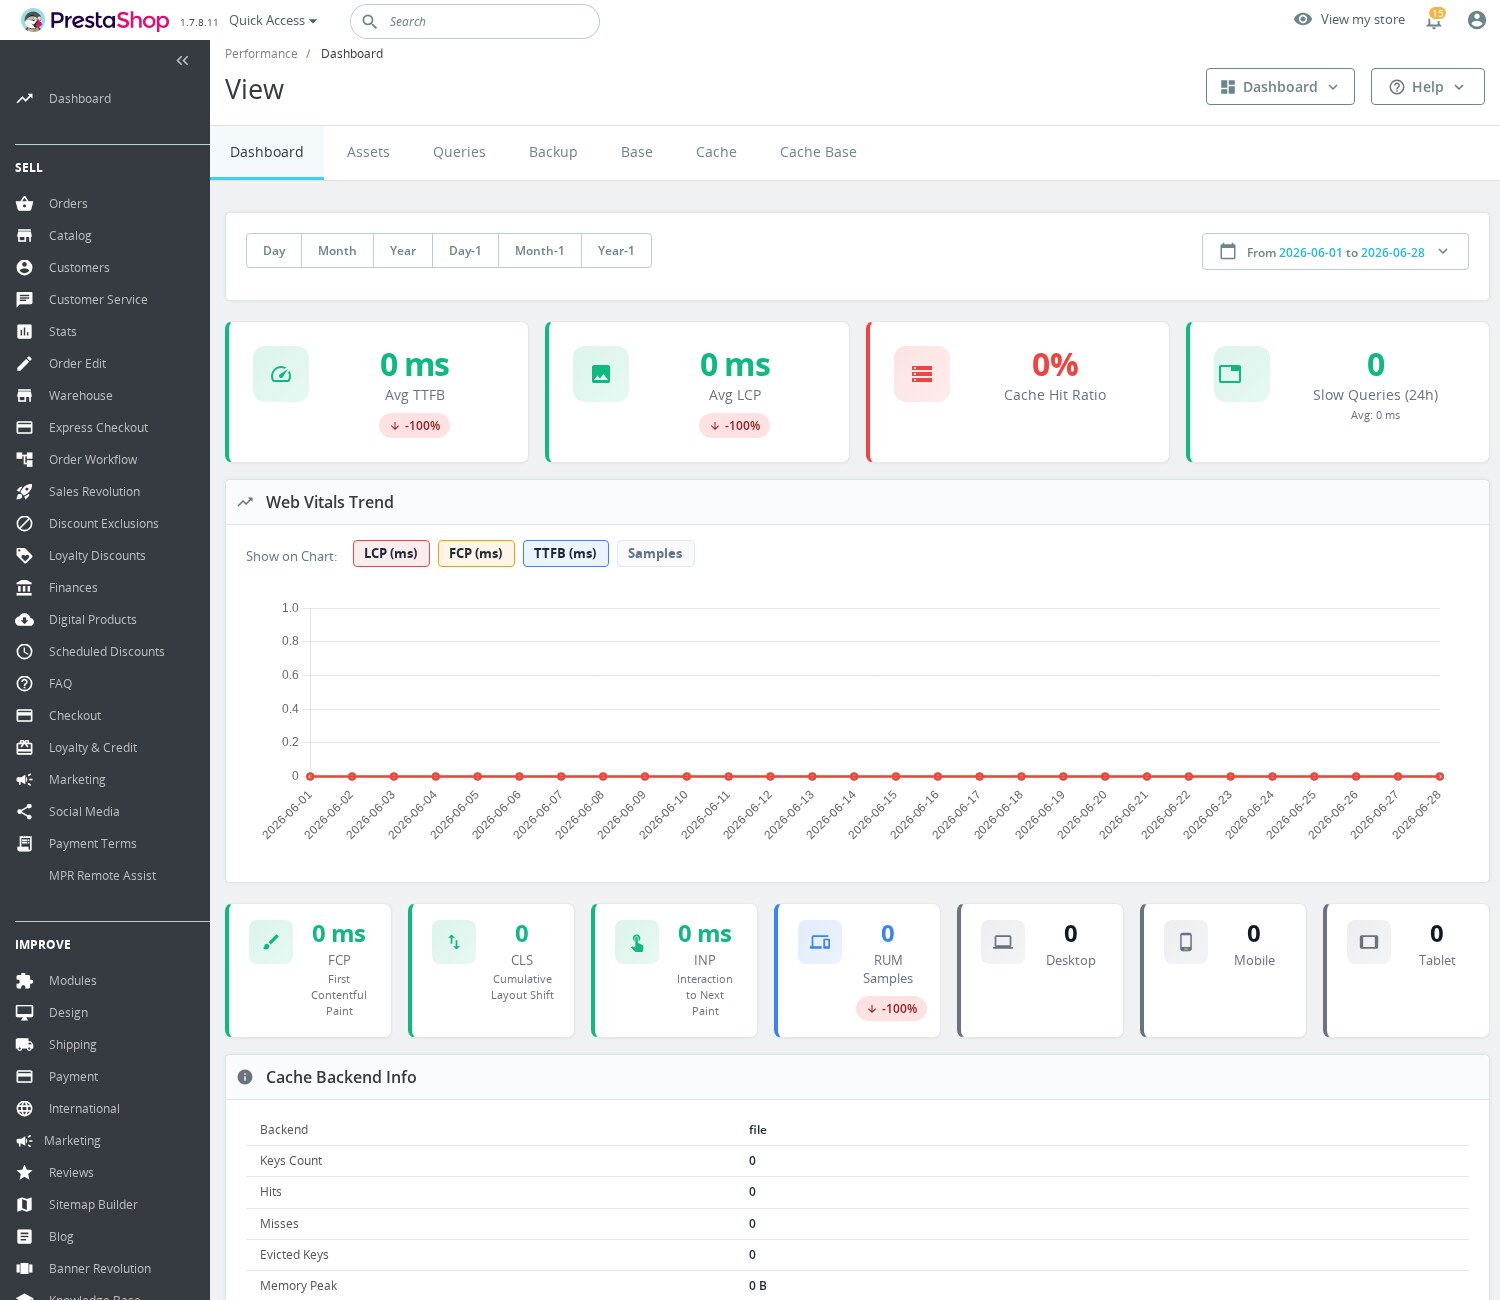
Keep before/after numbers in one place or optimizations become guesses.
Two fixes cost nothing, ship with PrestaShop, and should be confirmed before any purchase or upgrade, because they change every other reading you take.
Confirm CCC is on. Go to Advanced Parameters → Performance and enable Smarty caching and "Combine, Compress and Cache" (CCC) for CSS and JavaScript; if your Apache/.htaccess setup supports it, also enable the Apache optimization / browser-cache directives for static assets (this option isn't applicable on nginx-only servers). Many stores run for years with these off. Turn them on, clear the cache, and re-run PageSpeed. Your front-end numbers may move on their own. (One caveat: CCC can occasionally clash with a poorly-built module's assets; test the storefront afterwards.)
Audit your module count. Every front-office module adds CSS, JavaScript and PHP to every page load. Open Design → Positions to see how many modules are hooked into the front office, and uninstall, not just disable, anything you're not actively using. A store carrying 100+ modules will fight its own hardware. The mechanics of which modules hurt and why are covered in what actually makes PrestaShop slow.
Where a module earns its place, and where it doesn't
Once your diagnosis points squarely at server response time, high TTFB, every page regenerated for every visitor. That's the case a full-page cache is built for. Instead of PHP and the database rebuilding the same category page thousands of times a day, a full-page cache serves ready-made HTML and the server barely breaks a sweat. Our Performance Revolution module is our answer to that specific reading: it caches whole pages so TTFB drops without you rewriting a theme or moving host. So what does that mean for you? The pages your customers and Google hit cold come back fast, the work installs and configures from the back office rather than a developer invoice, and, because it's the server-side bottleneck you measured, the improvement shows up on every visitor, not just the lucky ones with a warm cache.
The honest boundary: a full-page cache fixes a slow server response. It does not shrink a 5MB hero image or fix a layout that jumps. Those are front-end problems your waterfall flagged, and they belong to image optimisation, not caching. Match the fix to the reading. If Redis is what your cache-backend reading calls for instead, our Redis Cache Manager & Monitor module covers that branch, and the dedicated Redis guide explains when it's the right call.
Measure, fix, measure again, over weeks, not days
Record your baseline before touching anything: mobile PageSpeed score, the three Core Web Vitals from Search Console, TTFB, and your cart-to-order conversion rate. Change one thing, then re-measure, but give field data time. Search Console's Core Web Vitals report runs on a 28-day rolling window, so a fix you ship today won't fully show in the field for weeks. Judging an optimisation on three days of data is how merchants revert a change that was actually working. Pair the speed numbers with behaviour: Google Analytics GA4 shows page-load timing, and Microsoft Clarity shows whether slow pages line up with rage clicks and quick exits, the human side of a bad LCP.
Why this is worth the afternoon
Speed work isn't glamorous, but it has a quality marketing rarely does: it helps every visitor, every time, with no campaign to manage. The often-cited figure that each extra second of load time costs conversions varies by study and by store, treat it as directional, not a promise, and measure your own before-and-after rather than trusting a blog number. What's reliable is the method: don't guess, check; read the TTFB to split server from page; let the failing metric name the repair shop; do the two free fixes first; and only then spend money on the bottleneck you actually measured. A store that's diagnosed properly gets fast for a fraction of the effort of one that's optimised by vibes.
Frequently asked questions
My PageSpeed score is fine but the store still feels slow. What am I missing?
You're probably reading the lab score and feeling the field reality, or vice versa. The big coloured circle is a single simulated load; what your customers actually live through is the CrUX field data higher up the report, and the Core Web Vitals report in Search Console. Also check whether you're testing logged into the back office, a warm cache and the admin session flatter your numbers. Test in an incognito window with the network throttled to "Slow 4G" and the gap usually explains itself.
Is a high TTFB always a hosting problem?
No, and assuming so is the most expensive mistake here. A high TTFB only tells you the slowness is server-side. It does not say whether the cause is the database, a heavy module, or the hardware. Run the profiler: if a page fires hundreds or thousands of SQL queries, that's the database or a looping module, and a bigger server just runs the same slow queries faster. Separate the two before you spend money. What actually makes PrestaShop slow walks through telling them apart.
Will a full-page cache fix a bad PageSpeed score?
It fixes a slow server response, high TTFB on pages regenerated for every visitor, and nothing else. It will not shrink a 5MB hero image, fix a layout that jumps (CLS), or untangle render-blocking JavaScript; those are front-end problems your waterfall flagged. Match the fix to the reading: a cache for the TTFB branch, image optimisation for the LCP/CLS branch.
How long before I trust that a change worked?
Lab tools react instantly, but Search Console's Core Web Vitals report runs on a 28-day rolling window, so a fix you ship today won't fully show in the field for weeks. Judging an optimisation on three days of field data is how merchants revert a change that was actually working. Re-run the lab test immediately for a sanity check, then give the field data its month before you conclude.
Is it safe to turn on the profiler on my live store?
Do it on a staging copy. _PS_DEBUG_PROFILING_ exposes internals and the bar to anyone who hits the page, and _PS_MODE_DEV_ can leak error detail, neither belongs on production. Enable, take your readings, switch both back to false. On PS8/9, the dev-mode Symfony toolbar gives you the same query count with the same caveat: staging only.
Related reading
- Performance Revolution, the full-page cache + critical CSS module for the high-TTFB branch, with before/after metrics in one panel
- What actually makes PrestaShop slow, database vs modules vs hosting, once your TTFB reading says "server-side"
- Performance tuning: database queries to full-page cache, the deep fix for a high SQL query count
- Database cleanup over time, for a TTFB that creeps up as the store ages


